
The Execution Details Viewer
The Execution Details Viewer is used to debug code. When enabled, the Execution Details Viewer displays details about the code that runs when a command or unit test is executed. It shows the functions, clauses and variable bindings for each step in the execution process.
To open the Execution Details Viewer, select Execution Details from the View menu or press Shift + F5. The dialog box can be docked or remain free floating.
To view the execution details, click the ON/OFF button on the menu bar or press F5. The Clear button clears the details from the window, the details can also be cleared by pressing Alt + F5. Note that the main menu also includes an Execution details ON/OFF item under the File menu so that you can turn the execution details on or off from anywhere in the application by selecting this item or by pressing F5. Selecting this item is identical to pressing the Details ON/OFF button in the Execution Details Viewer.
The Execution Details are normally turned off after a single command or unit tests is executed. Most commonly, you only want the details for a single function. Any details already in the display are also cleared each time new details are added.
If you want the details to stay on, select the Lock ON/OFF button in the Execution Details Viewer or press Ctrl + F5. New details will be added each time a command or unit test is executed until the details are turned off by either selecting the Lock ON/OFF button again or by turning the details off by selecting the ON/OFF button in the viewer or by pressing F5.
If you need to see details from more than one command or unit test, the last button on the left toggles between Display: Single and Display: All. If Display: Single is selected (the default) any old details are cleared each time new details are added. If Display: All is selected, the display is only cleared when the Clear button is selected.
The Execution Details Viewer shows the execution path for a command or unit test in a form that is similar to the call stacks that are typically displayed in debugging tools. The difference is that the execution details captures all of the details of the execution process, not just the current call stack at some specified breakpoint. This allows you to not only see what code was executed and all of the values that are bound to variables as the code is executed, it also allows you to move around in the details as needed to locate any problems in the code.
This is the content of the Execution Detail Viewer after applying the Equivalence command to the expression

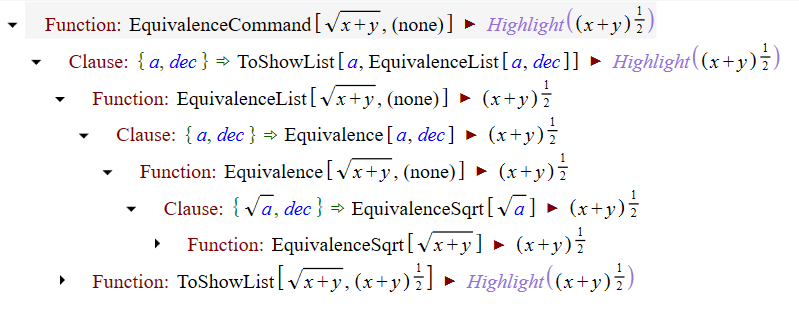
The top level node in the details is the EquivalenceCommand function call that is initiated by highlighting the expression and pressing the "q" key. In this example, several of the child nodes under the EquivalenceCommand function call have been expanded. The Execution Details are displayed as a tree and the nodes can be expanded either using the mouse or the arrow keys. The right and left arrow keys open and close the child nodes in the usual way. If you are navigating through a number of levels, the arrow keys are typically the fastest way to get to the details you need for debugging.
The first child is the clause in the EquivalenceCommand that generated the result expression. Under the clause there are two function nodes that are generated when the right-hand side of the clause (ToShowList[EquivalenceList[a, dec]]) is processed.
The first of these two functions, the EquivalenceList function call, has been expanded in this image to show the nodes underneath it. The Function node has also been expanded to show its Clause node.
Variables in the Execution Details
On the left side of the Execution Details Viewer, below the buttons, there is a display that shows the variable bindings for the currently selected node in the details. In the example discussed earlier, the variables "a" and "dec" appear in several of the Clause nodes. These variables have expressions bound to them and those expressions are displayed in the Variables pane of the Execution Details Viewer.
If the selected clause or function in the Execution Details Viewer did not execute because a pattern match failed, you will also see a display of the failed pattern match. For example, if the clause is

and the expression pass into the second parameter is a square root, you might see something like:
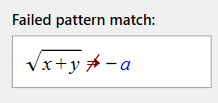
on the left side of the Execution Details Viewer because a expression that begins with a square root doesn't match an expression that begins with a minus sign.
Nodes in the Execution Details
- Function
The Function node is added each time a function is called during the processing. The name of the function and the parameters passed to it are displayed. The expression returned from the function is shown to the right of the arrow following the function.
- Clause
The Clause node is added under the Function node. A Clause node is created for each clause that is executed, but by default only the clauses that generated non-null results are shown. You can display all of the clauses by right clicking on the Function node and selecting Show all clauses or by highlighting the Function node and pressing F7.
- Internal function
The Internal function node is added under the Clause node each time a built-in function is executed inside of a clause. The difference between a Function node and an Internal function node is that an Internal function node doesn't have clauses under it because built-in functions don't contain clauses. An Internal function node can have Condition and Function nodes under it, depending on the parameters passed into the internal function.
Note that an assert expression is technically an internal function, but when it appears at the top level of a clause, the node is displayed as a Clause node rather than an Internal function node.
- Unit test
Unit test nodes always appear at the top level of the Execution Details tree. A Unit test node is added each time a unit test runs when the Execution Details are enabled.
Note that Unit test nodes are not generated when you run multiple unit tests from either a Unit Test Module or from the Unit Test Runner. Unit test details are only generated when you run a single unit test by highlighting it in a Unit Test Module and pressing the F8 key.
Context menus
Function nodes and Internal function nodes:
- Show all clauses/Show only clauses with results (F7)
By default, only clauses with results are shown in execution details. Typically, these are the only clauses that you need to see. But in a case where there is a clause that should have generated a result, but didn't, you will need to be able to view the details of that clause to discover what's wrong with the functionality.
Note that even if you select Show all clauses, the execution details will still only include the clauses that were actually executed. So if a function has 10 clauses and the second one generates a result, the second clause will be shown by default. But even after you select Show all clauses only the first and second clauses will be shown in the execution details because those are the only ones that were processed.
For Internal function nodes, this menu item is disabled.
- Show all matches/Show only matches with results
Some patterns (typically patterns involving list variables) will generate more than one match. By default, only matches that generate a result expression are shown because typically those are the only ones that you will need to see. This context menu provides a way to see all of the matches generated by a condition in cases where this is needed.
- Go to function
Opens the Object Module containing the function with the selected function highlighted.
- Go to parent clause
A clause can contain multiple levels of function and internal function calls under it. The parent clause is the clause that contains the function or internal function in the current node. You can find the parent clause by looking up in the Execution Details Viewer until you see a Clause: node. This is the parent clause.
This menu item opens the Object Module that contains the clause with the selected clause highlighted.
- Copy
The nodes in the execution details are expressions just like any other expression in other windows. This context menu item makes a copy of the highlighted node in the execution details and puts it onto the clipboard.
- Copy as unit test
This context menu item converts the highlighted node to a unit test expression so it can be copied into a Unit Test Module. If you find a problem several levels down in the execution details, it's often convenient to capture the failing function call as a unit test and continue the debug process using that unit test rather than the original expression.
Clause nodes:
- Show all matches/Show only matches with results
Some patterns (typically patterns involving list variables) will generate more than one match. By default, only matches that generate a result expression are shown because typically those are the only ones that you will need to see. This context menu provides a way to see all of the matches generated by a condition in cases where this is needed.
- Go to clause
Opens the Object Module containing the clause with the selected clause highlighted.
- Copy
The nodes in the execution details are expressions just like any other expression in other windows. This context menu item makes a copy of the highlighted node in the execution details and puts it onto the clipboard.