
Graphs - Overview
Graphs a created using objects just like any other expression. The objects used to create a graph define the data, the axes, the legend and so on. You can edit these objects by switching to the Standard notation. In the Document notation the actual graph is rendered rather than the editable objects that make up the graph.
To add a graph to your document you need to first add a reference to the Graph.eql library. A very simple graph could be defined by
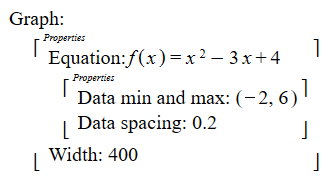
it would be created the same way that any other expression is created in Sym. Graphs can be switched from being an expression to being displayed as a graph using the Rendering Options command (F3) or by changing the module between the Standard and Document notation. The Question command (?) is useful when creating and editing graphs. For example, if you highlight the empty box in a Graph: object, the Question command will display a list of all of the components that can be added to the graph.
The components of a graph are covered in
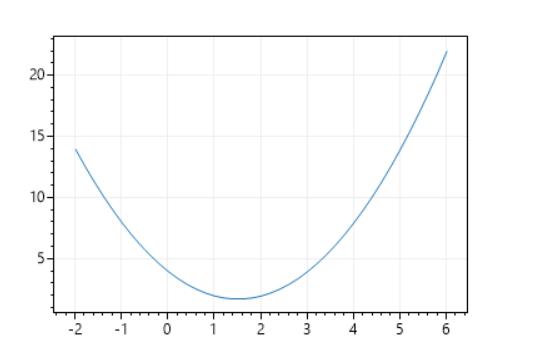
In Document notation, this graph would look like:
There are example graphs in the GraphAndImageExamples.equ document in the Documents location.